


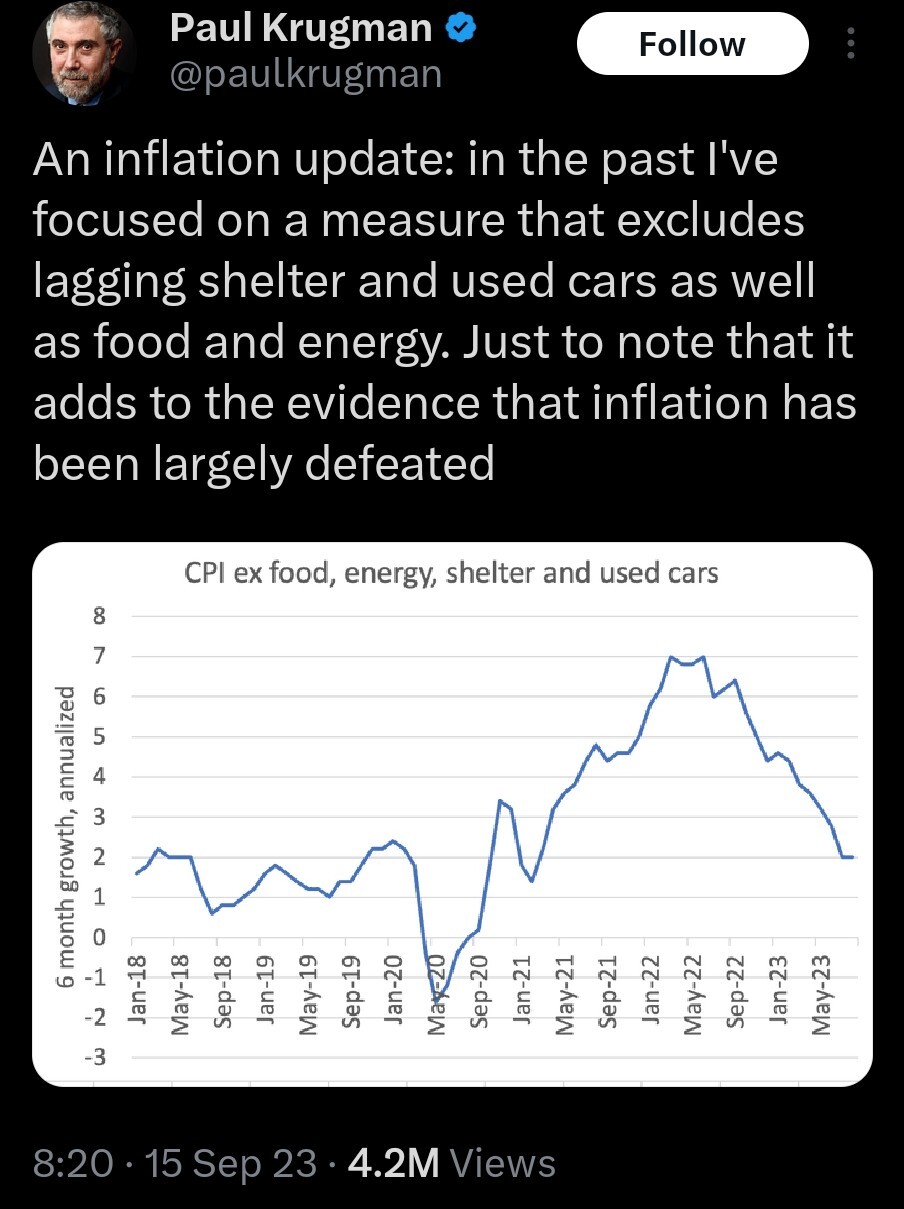
It’s silly to present only this graph, then. Surely it’s possible to put a dashed line next to this one that includes the “lagging” measures and just stops where the data stops or becomes unreliable, but would still show the trend(s).
Or hell show each component as a different line, maybe faded some, and end each line where the data become questionable, and put the composite line darker/bolder. Lots of good options.
If we’re back at/near the target 2%, that does count as “defeated” from the point of view of the monetary policy makers. But I’d need to see complete inflation data to be certain. If we’re missing inflation data because it “lags,” then we’ll know one way or another later.
Learn how to integrate nerd. Is math foreign to this dude?
Even if this included the biggest contributors, it’d still be a massive increase in prices. Fucking jackasses are so bad at graphing, if they were actually trying to show shit they’d be showing the change in the cost/wage ratio. The concept of normalization and useful statistics is so foreign to these jackoffs.
Motherfucker should be banned from touching excel or a real graphing software ever again.
Holy shit I just found out this asshole’s a professor. AN EX STANFORD/MIT PROF. If I tried to pull this shit my PI would have my summarily executed. ECONOMICS DOESN’T GET TO BE A SCIENCE IF YOU MAKE EVERYTHING UP. READ MARX AND KILL YOURSELF KRUGMAN

thinking about how measures from the very first dictatorship of the bourgeoisie [well okay maybe second if we’re going to count a*glos] are heresy in the modern bourgeois ideology.
a fucking single price control on bread would immediately reduce the cost of living, and be massively popular. leveraging the subsidized food markets (the government is already interfering!) you could shave off hefty proportions of folks’ food bills, and get fucking swept into office next year.

This reminds me of that sports copypasta/meme; “If you take [star athlete] and ignore the top twenty percent of their performances as outliers and then do a regression analysis, you’ll see they’re actually an average athlete for their position.”

What’s left then? Luxury goods?


